We are surrounded by data in today’s fast-paced environment, yet quickly interpreting it can be challenging. Data visualization can help with it. It enables us to make informed decisions, gain insights more quickly, and stay up with the rapid pace of change by transforming raw data into understandable images.
Making Data Easy to Grasp
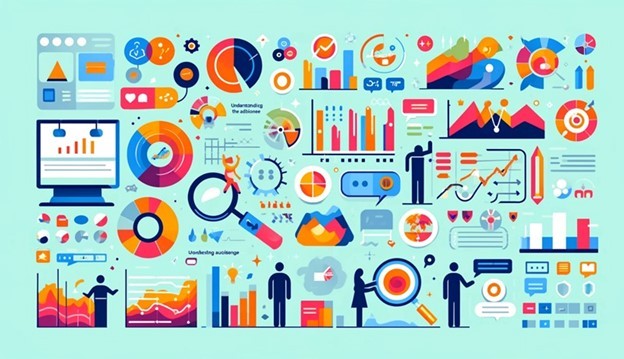
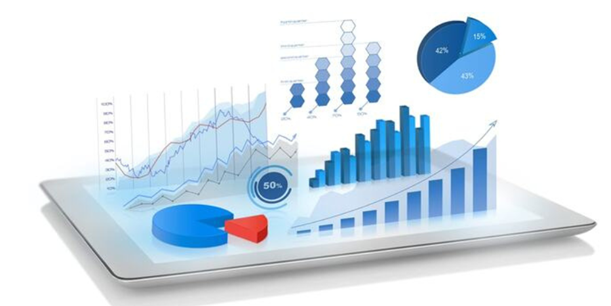
Compared to words or numbers, humans process images more quickly. Data visualization enables us to view the larger picture quickly by simplifying complex information into charts, graphs, and other visual aids. Patterns and important information are immediately apparent, eliminating the need to sift through countless rows of data.
Helping You Act Fast
Quick decisions are key in many fields. When data is shown, finding trends, changes, or problems that require attention is much simpler. With the most recent information to inform us of the next step, it allows for quicker and more assured replies.
Revealing Hidden Trends
Visual representations of data can highlight relationships and patterns that spreadsheets often lack, especially in healthcare. For example, a heat map could identify areas with a high number of patient admissions, while a line graph might reveal spikes in cases during certain months. These visual clues help shape better strategies.
Overcoming Communication Deficits
Everyone, even non-data professionals, can better grasp data when it is presented visually. Since all teams are using the same data, discussions between them run more smoothly.
Spotting Errors Quickly
Charts and graphs can also highlight data issues. If something doesn’t look right, like a sudden spike, it may flag a mistake or an unusual pattern that needs to be checked. Fixing these issues early keeps your data accurate.
Drawing in Your Audience
Data shown visually is simply more appealing. Interactive visuals, dashboards, or infographics catch people’s attention and make it easier to dive into the details. It’s not just about understanding the data; it’s about sparking interest.?
Adapting for Different Needs
Different people need different levels of detail. Visualization helps tailor the information for various audiences, from high-level summaries for managers to detailed views for data professionals.
Planning for What’s Next
Data visualization isn’t just for looking back. It’s useful for spotting trends that help predict the future. These insights can be used by businesses to plan inventory, create goals, and modify their approaches before problems occur.
By turning data into visualizations, you can quickly cut through the noise and see the bigger picture. It’s like turning on the headlights in a data fog—helping you navigate smoothly and choose the best path forward with confidence.